
EnergyPLAN
BASIC INFORMATION
EnergyPLAN is a software simulates the large scale of dynamic energy systems hourly in every sector and allows for a holistic review, such as electricity, transport, industry, cooling and heating. The obvious point makes EnergyPLAN becomes more outstanding is the highlight patterns and trends of interaction between sectors including energy, environment, and economic impacts. Regarding to that, researchers, consultancies, and policymakers can make the better decisions. The software is developed by Aalborg University, Denmark.

The diagram shows a holistic connection in every sector
EnergyPLAN has ability to simulate the energy system by adding the data input in the program. The results can be shown in spreadsheet or graphical chart of each sector, for example, electricity, district heating, or grid gas.
Advantages
-
Data analyses every hour for a complete energy system
-
A global users network accessed
-
Suitable for any specification including a normal PC
-
Online training, documentations, and case studies from different countries are provided
-
Help tools are added on by the third-party developments
-
Free of charge
EnergyPLAN IN THE PROJECT
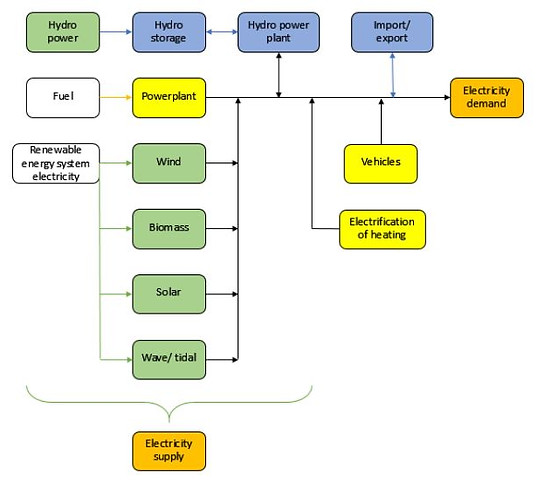
The diagram above shows pathway used in the project
Electricity is only one sector is focused on. However, transport and heating sectors are taking as part of the future electricity demand as an electrical or hybrid vehicles and electrification of heating. In term of supply, renewables play the main part followed from the Scottish government targets. Gas and nuclear are considered as a base load.
VALIDATION
-
The data base from 2016
-
The most recent data we can get from the Scottish government
-
The interested reduction trends of electricity demand and import
-
In the pathway of Scottish energy strategy
-


To analyse the results, annual data in every hour is very important.
As you can see that the trend from EnergyPLAN (lower graph) is similar to the graph from Scottish government (upper graph).
Comparison
To prove that the data we got from the Scottish government as a set of data input were run correctly, the different percentages are done in part of data validation.

The comparison between the data from Scottish government and the results from running EnergyPLAN are done in the bar chart. All percentages are lower than 10%, which is acceptable.
Reference:
Energyplan.eu. (2017). EnergyPLAN | Advanced energy systems analysis computer model. [online] Available at: http://www.energyplan.eu/ [Accessed 9 May 2017].